These Charts Have Good News for Short-Term Traders
Andy Snyder|October 3, 2022

We’ll keep it short and simple this morning – just a few important charts.
It’s looking to be a busy week. We’re hosting a live call with our paid subscribers on Wednesday. We’re working overtime to bring you something quite interesting (for free!) from some friends. And, well, the market is giving us all sorts of trading opportunities to dive into.
We watched several of our short positions surge during last week’s market mayhem. We’re batting a thousand on them.
Will we see a repeat of the uber-bearishness this week?
At least one indicator says no. It’s telling us this may be a good week to get in… and get back out with some profits.
It has to do with this oddball chart…
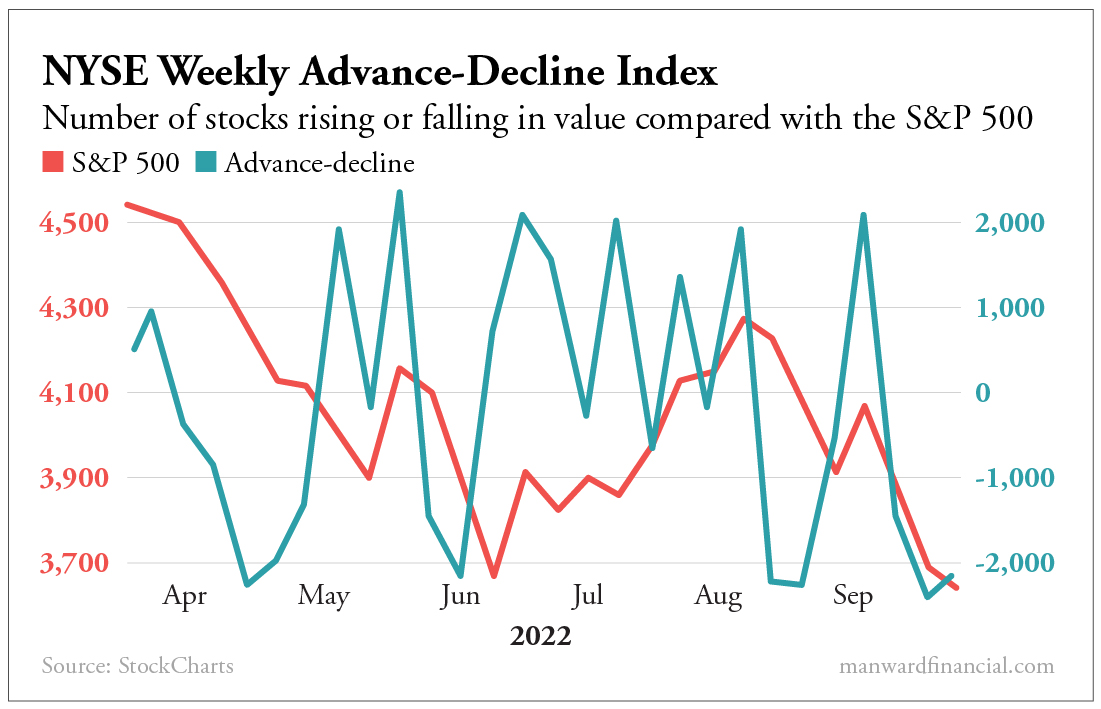
The chart looks complex, but it’s not. It’s showing us two separate things.
First, the teal line is a breadth indicator. It shows the number of stocks on the NYSE that are increasing or decreasing in value. In this case, we’re looking at weekly data.
When the teal line is above zero (using the right-hand numbers), it means more stocks are rising in price than falling. When that line is below zero… the opposite is true. More stocks are falling.
As you can see, the indicator hit new lows for the year last month. When that’s happened previously, stocks have rebounded quickly.
We can see that play out in the red line. It represents the S&P 500. It shows the index tends to rise after the advance-decline index bottoms out.
That makes sense. If more stocks are rising than falling… the index should rise.
Without considering the other macro factors in play this week, that appears to be where we’re headed – toward a short-term pop.
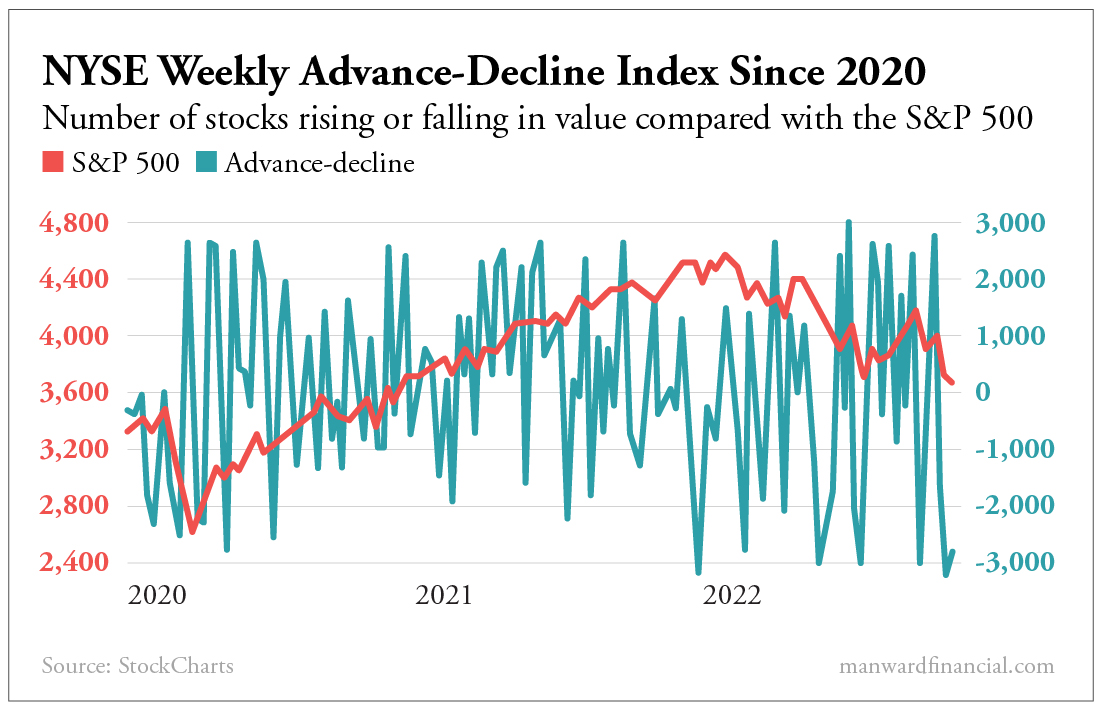
Zooming out to include the COVID-19 meltdown, you can see how tough the last 10 months have been. The number of weeks where declines outnumbered advances by a wide margin has been quite high – far higher than it had been over the previous two years.
But look at this… the same indicators, but on a monthly scale. It shows why “hold your nose and buy” investing hasn’t worked.
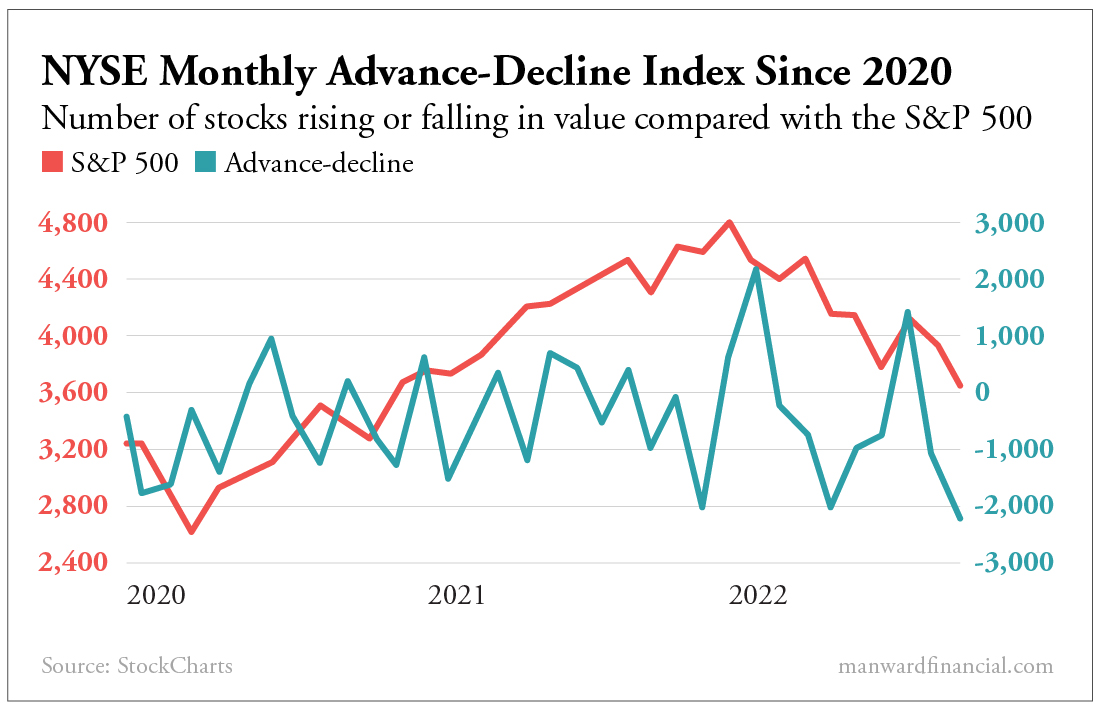
The COVID-19 crash was so fast-moving that it hardly registers when we look at the advance-decline index over 30-day periods. The same clearly can’t be said for the gut-testing bear market we’re in now.
But we can see that the last two times the index hit this level, we got a fairly strong relief rally in the ensuing few weeks.
There’s little doubt about the long-term trend. There’s more trouble ahead.
But in good news for fast-moving traders looking to make a speculative bet… a quick move higher looks to be in the cards.
Take advantage of it.
Get in. But be ready to get right back out.