Is Target a Buy After Blowout Earnings?
Andy Snyder|August 30, 2021

It’s amazing the attention $15 billion can get you.
Our inbox was stuffed with folks asking for our view on Target (TGT) after the company announced a huge share-repurchase plan.
The company’s earnings announcement earlier this month was solid. It beat expectations all around, and company executives described the business as doing well thanks to a “healthy and resilient” customer base.
So… with a brand-new buyback program that’s worth more than 10% of the company’s market value and a bullish outlook from Target’s top brass, are TGT shares worth your money?
Our beloved Liberty Indicator will tell the tale…
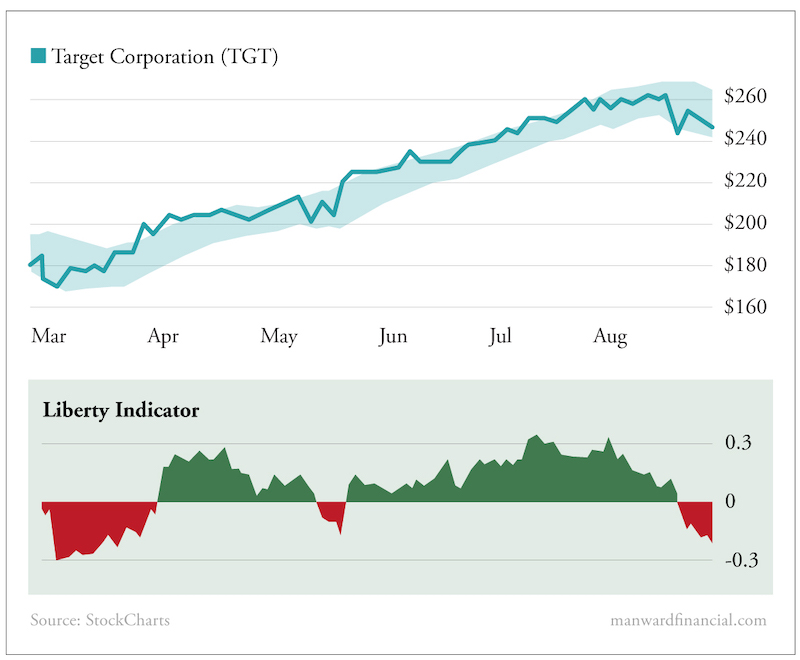
The first thing we see is that the indicator is in the red. At first glance, that’s not good.
But there’s more to this chart…
This one requires some interpretation.
It’s important to note that the dip in the chart preceded the company’s earnings report. The dip started several days before Target opened its books, and the company rebounded only after it released good news.
Like we’ve seen so many times during this earnings season, skittish investors are eager to lock in their gains at record highs just before a company releases its earnings report. They’re looking to avoid the volatility.
In this case, that took the Liberty Indicator deep into the red.
Now the question is: Will it turn green sometime soon?
Conservative investors should wait for the chart to reveal a change in color. But with some experience and a bit of extra charting wizardry, speculators may have a nice opportunity on their hands.
That’s why we chose to dive into this chart today. It shows that for every rule… there is a profitable exception.
In this case, we added what we call K.I. Channels to the chart. Our Venture Fortunes subscribers should know these well. The shaded blue channel acts like a guardrail for the stock price, always working to keep shares in their lane.
You can see it works well.
More importantly, you can see that Target recently went from the top of its channel to the bottom of its channel, where, just as we’d expect, the “guardrail” kept the stock from dropping too far too fast.
That brings us to a critical point for the stock. Will it dip back to the guardrail and start a long-term trend lower? Or has the Liberty Indicator reached the nadir of its dip, meaning Target will start climbing from here?
The action this week will be telling.
If Target falls below $244 per share and does not rebound, it’s very likely the start of a downturn.
But if it stays above that level and runs higher, the momentum that we saw over the last six months is almost certain to continue.
It’d be the rare exception to the rule that has us buying when the Liberty Indicator is at its lowest point. Because it’s based on 20 days’ worth of data, the indicator can lag behind a sudden turnaround.
But we can get ahead of the move and be assured of a high-probability trade because we used K.I. Channels to confirm a rebound.
This one’s a bit complex. But it could have some huge short-term potential.
Watch it over the next three days. A bounce off that lower bound will be a very bullish move.
Keep sending the tickers. We love digging through them. Email us at mailbag@manwardpress.com.