The Liberty Indicator Weighs In on Nio
Andy Snyder|August 23, 2021
How about we just make Monday the day when we dive into your stocks with the Liberty Indicator?
Sound good?
What’s better than learning a new system… and making some money in the process?
Wowzers… we got a lot of tickers last week. Some folks sent a dozen or more, asking for our input.
It’d be impossible to cover them all in this column, and the fine folks in Washington say we need a license to reply to each person individually. So we’ll do what we can in this space and cover the hottest of the hot tickers.
Lots of folks asked about the Chinese electric vehicle maker Nio (NIO) last week.
It’s a hot stock. It’s consistently one of the most traded tickers on the New York Stock Exchange.
Its chart paints an interesting tale.
But before we get to that… let’s look at some fundamentals.
Money Matters
Nio is a big and growing company. It has a $60 billion market cap, had sales of $1.3 billion last quarter and delivered nearly 22,000 cars over the last three months.
Every figure soared over the past year.
As the so-called “Tesla of China,” Nio gets – and deserves – a lot of good press.
And with good press comes a good stock price.
But Nio is off its highs… way off.
The stock peaked very early in the year at $66.99 per share. Today, shares trade for just north of $35 each.
Does that mean we should be buying?
Let’s take a look at the chart…
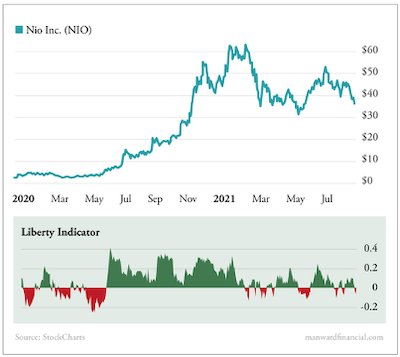
If you’re a longtime reader, the early part of this chart may look familiar. We first detailed Nio and the opportunity it represents in May of 2020… when shares were just $3.37.
Zooming in, you’ll notice two things about that period.
First… our beloved Liberty Indicator went from red to green.
And second, just as we’d expect… shares zoomed higher.
Since we detailed the stock, shares have surged 1,900%.
Funny how that works.
And Now?
Again, the Liberty Indicator crossover last year was obvious. But what about right now? What does the Liberty Indicator say these days?
The answer isn’t quite as clear… or as bullish.
As you can see, the indicator has been quite choppy for most of this year. There’s no clear trend.
That tells us that buyers and sellers are nearly evenly mixed and that we’re not likely to see a major shift in sentiment.
On a short-term basis, the indicator is in the red right now. That means traders who want to make an in-and-out trade have a good opportunity to jump in when it turns green again. They stand to profit as shares likely rebound to the $45 level.
But if you’re looking for another one of our calls that lead to a 2,000% gain… the chart says this one is not it.
While the fundamentals are bullish for the stock, there’s too much uncertainty over China and its rule over its companies to get buyers into another frenzy.
If you’re itching to buy, wait until the Liberty Indicator gives us another setup like the one we saw in May. That’s when selling pressure consistently outmatched buying pressure and kept the indicator in the red for several weeks.
It pulled prices lower and created a springboard for a short-term surge. Folks who bought when the indicator turned green were rewarded nicely.
We say check back on the stock in three weeks. If the indicator is still red… put it on your watch list and snap up shares as soon as it goes green.
Until then, there’s not enough of a trend to power the sort of turnaround we demand.
Keep the tickers coming.
Email us at mailbag@manwardpress.com.
We’ll keep covering everything we can.

Andy Snyder
Andy Snyder is an American author, investor and serial entrepreneur. He cut his teeth at an esteemed financial firm with nearly $100 billion in assets under management. Andy and his ideas have been featured on Fox News, on countless radio stations, and in numerous print and online outlets. He’s been a keynote speaker and panelist at events all over the world, from four-star ballrooms to Capitol hearing rooms.