Buy or Sell Today? Use This Powerful Indicator
Andy Snyder|August 2, 2021
Follow the money.
It’s been the catchphrase of so many – pioneers, executives, detectives and, of course, smart investors.
For decades, we’ve made stock trading volume our thing. We track who is buying what and how much of it.
We watch what insiders are doing. We track the institutions. We follow the retail money. And we watch daily volume patterns.
It’s like sitting in a mall parking lot and watching the crowd on Black Friday. In no time, we see where the bargains are.
We use lots of tools. Some are simple. Some are not. But one stands above them all.
It’s so powerful, so good at unleashing the kind of profits that free folks from whatever chains that bind them, that we dubbed it the “Liberty Indicator.”
It’s quite simple.
By looking back at how price reacts to trading volume, we can create a score for each day’s action. When we average the scores over a certain time frame (we typically use 20 trading days), we can start to plot the action.
Looking at the S&P 500, we get a chart like this…

It’s the red and green section at the bottom we care about the most. The price action above it is secondary. In fact, with this strategy, it’s not needed. But it gives us a good reference to see how pricing reacts to changes in buying and selling pressure.
In this chart, everything is the same, except I circled key crossovers…
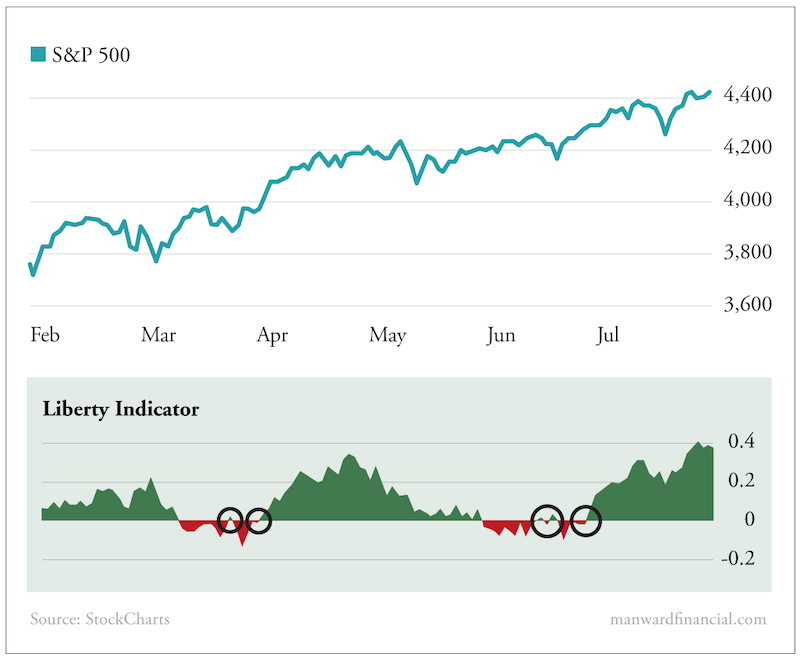
Each of those circles represents a shift in buying pressure. Each time the indicator goes from red to green, it tells us that buying pressure over the last 20 days has eclipsed selling pressure.
As the price chart above the indicator shows, each crossover – even the small ones – marks a wonderful buying opportunity. Even in a long-term bull market, like this chart is showing, they offer a shot to get in at a short-term discount.
The indicator tells us when to be cautious, too.
The indicator in the above chart is as tall as it’s been in six months. Buyers are out in full force looking for discounts. The mall parking lot, in other words, is jam-packed.
In times like these, the Liberty Indicator tells us to be cautious. Things could be peaking. The bargains are tough to find.
It doesn’t mean we don’t buy – stocks tend to rise anytime the indicator is green. But it does tell us to keep our positions smaller and our trailing stops tighter. A pullback is likely.
Pretty liberating, right?
Send us the tickers you want us to apply the Liberty Indicator to with an email to mailbag@manwardpress.com.
And to see how we recently used the indicator to uncover a big buying opportunity in the crypto market, click here.

Andy Snyder
Andy Snyder is an American author, investor and serial entrepreneur. He cut his teeth at an esteemed financial firm with nearly $100 billion in assets under management. Andy and his ideas have been featured on Fox News, on countless radio stations, and in numerous print and online outlets. He’s been a keynote speaker and panelist at events all over the world, from four-star ballrooms to Capitol hearing rooms.