The Only Two Forces That Affect Stock Prices
Andy Snyder|August 16, 2021
Note: The response to our Liberty Indicator column has been outstanding! We’re excited to continue looking at your favorite stocks with our No. 1 indicator for buying and selling. But for today, we wanted to share more about just how the Liberty Indicator works. Continue reading for exclusive research normally reserved for our paid subscribers. And be sure to send your tickers to mailbag@manwardpress.com.
– Amanda Heckman, Editorial Director
If you’ve ever watched the financial media, you’ve seen countless complicated charts, crazy metrics and downright silly trading strategies, all developed for making money in the stock market.
But most of that information is complete bunk.
And it’s not just a waste of time… By following the financial media’s advice, you’re also wasting your hard-earned cash.
The truth is, there are only two forces that determine a stock’s price…
Buying pressure and selling pressure.
By tracking those two simple trends, we can spy on the markets, bank massive profits and stay well ahead of the 24-hour news cycle.
It’s simple.
When buying pressure is greater than selling pressure, the stock price rises. And when selling pressure is greater than buying pressure, the stock price drops.
That might seem incredibly simple… but that’s exactly the point. It really is that simple. It’s just that most traders have no clue how to effectively measure those two all-important forces.
In short, the secret to making money in the stock market is identifying when buying pressure begins to dominate a stock.
And with our proprietary Liberty Indicator, we’ve found a way to identify the exact moment when buying pressure begins to dominate selling pressure.
Time to Buy?
You’re about to discover the holy grail of reliable income in the stock market.
Below is a chart that shows what I call the Liberty Indicator.
What you’re looking at is a line that measures the difference between buying pressure and selling pressure.
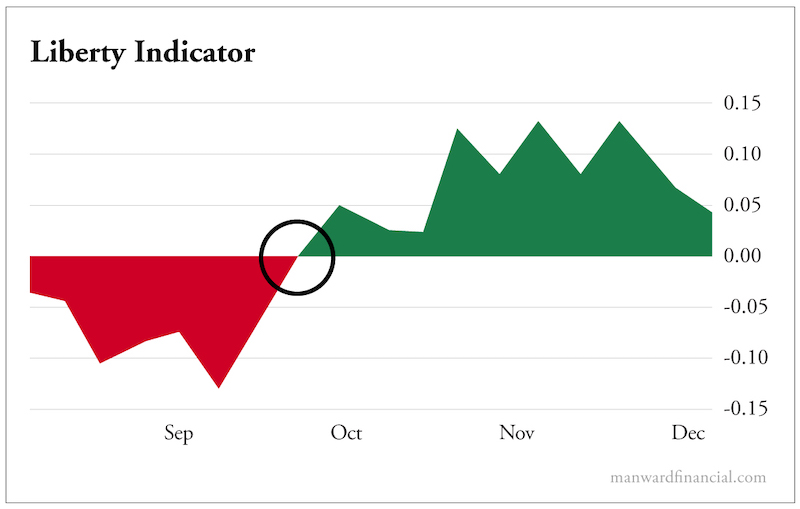
When the Liberty Indicator crosses above zero… into the green zone… that’s when buying pressure is higher than selling pressure.
And that’s when stocks go up.
It’s just that simple.
You don’t have to look at complex financial statements… and you definitely don’t need to learn any complicated trading techniques.
When buying pressure begins to dominate, stock prices can’t help but rise.
The indicator itself can be broken down into several components… but most importantly, it’s used to determine whether the trading volume in a stock is bullish or bearish.
You see, it’s the never-ending tug-of-war between buyers and sellers that determines the direction of the stock price.
And the Liberty Indicator quantifies and measures that market behavior.
But it’s not the only criterion we use when entering a trade.
After all, there are literally hundreds… even thousands… of stocks that could have buying pressure dominating.
But not every stock is a winner… and not every stock is set up to make huge profits.
That’s why we’ve developed a number of time-tested criteria to determine which stocks have the highest probability of seeing a spike in price.
These criteria involve monitoring spikes in trading volume… pricing parameters to eliminate overvalued stocks… and moving average crossovers, to name a few.
Remember, we’re looking for only the most profitable opportunities in the market. The Liberty Indicator is a confirmation tool that gives us the green light to get into a trade.
After that, all you have to do is sit back and wait for the price to run up… big!
What’s really exciting about the system is that it works equally well with nearly every type of trade. We’ve counted at least seven different types of trades that work with this unique algorithm.
With this system, we can…
- Go long on an equity
- Go short on an equity
- Play an option long
- Play an option short
- Sell covered calls
- Sell puts
- Play long-term options called LEAPS, or Long-Term Equity Anticipation Securities.
With Alpha Money Flow, where we use the Liberty Indicator, we typically stick to long positions, but if the market takes a sustained turn for the worse, we will certainly use our prized algorithm to profit from falling prices.
This approach creates an incredible system for building and protecting your wealth and achieving the financial freedom you deserve.
Note: Send an email to mailbag@manwardpress.com with the tickers you want to see the Liberty Indicator applied to.