A Warning About the Housing Market in Two Charts
Andy Snyder|February 27, 2023
We held our monthly live video call with our VIPs last week.
It’s the highlight of our month.
It’s our chance to sit down with our best subscribers and talk all things investing.
It’s a no-BS zone with a tight focus on what it takes to make money.
We started with a bit of a victory lap…
Aslide of some of the positions we recently sold.

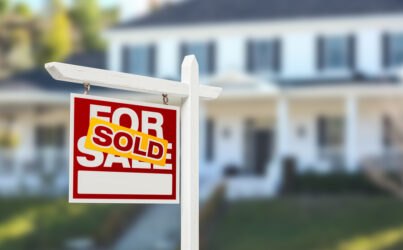
Then we got into the meat of it. Interest rates… the dollar… crypto… and near the end of it all, a close look at real estate.
This is where things got interesting. We were touting facts that most hadn’t heard before.
We started with this chart… very simple.

It shows the price of the average home based on a long-term index. It shows what we all know… prices have soared in recent years.
But it doesn’t show something that most folks have assumed… that the bottom is falling out of the market.
That’s not the case – at all.
Price increases have slowed. Some markets have softened. But overall, prices have hardly budged.
We got evidence from Toll Brothers (TOL) last week that backed up that fact. Its sales were up 4% from last year. Its bottom line smashed expectations. And its average home sold for more than $900,000.
Shares surged higher.
Toll CEO Doug Yearley summed it up this way… “The most telling sign that these fundamentals are real and meaningful is the fact that rates didn’t have to go back to 3.5% or even 5.5% for buyers to come back out.”
It’s good news for homebuilders… but terrible news for the inflation hawks. The rate hikes so far are having only a psychological effect – not a material effect.
But it gets worse. Look at this chart…

It’s an oddball set of data that most folks aren’t familiar with. But it’s incredibly useful. Using things like pay growth, mortgage rates (which surged once again last week) and, of course, home prices, it shows a measure of home affordability.
The news there is not good.
In fact, affordability is lower now than it was just before the big housing crash that sent the economy into free fall. It hasn’t been this low since the 1980s, when double-digit mortgage rates made potential buyers weep.
It tells us that the folks who say the bottom is in for the housing market are either ignorant or, more likely, trying to sell you a piece of land.
Go back and look at that first chart again.
Prices didn’t roll over all at once in 2008. It took nearly four years of housing market pain for prices to bottom out.
Clearly, today’s prices have further to fall.
We’re ready to take advantage. We’ll be piling in… but not yet.
Patience is our greatest asset right now.